
Improving Productivity

Productivity Growth - Either do "more with same" or "same (or more) with less"
Despite many BBQ discussions centring on interest rates and property prices, economists in Canberra are devoting great swathes of water cooler discussion time to how Australia can improve workforce productivity to offset both price and wage inflation. This is important as generally, when annual inflation is running at 2% to 3%, wages will be increasing by around 3.5%. In this environment households can save and by default all Australians can improve their standard of living. However, to achieve this economic nirvana, productivity needs to be increasing by circa 1% per annum.
The simple word productivity though is triggering for many workers who instantly feel pressure from underlying expectations that they need squeeze more into already full days. Within the Pharmacy sector the overlay of increased regulation relating to both small business and Pharmacy means achieving productivity gains is even more complicated.
Productivity in a retail environment
The standard measures of retail productivity consider the dual resources of staff (measured via the number of full-time equivalents (FTEs)) and the space available to operate the business.
Generally, both are measured relative to the gross profit dollars generated by the business. However, the historical underlying revenue drivers within Pharmacy are being impacted by the ongoing expansion of service-based income streams. As such there is a need for space and staff allocations to be adjusted.
In isolation this should be relatively straight-forward, however Pharmacy has been grappling with a lack of staff resources for several years now. So how is Pharmacy coping with this challenge of increasing productivity in a highly inflationary wage environment amplified by increasing service delivery opportunities?
Based on Pitcher Partners industry averages, wage growth was stagnant prior to the SARS-CoV-2 outbreak. In fact, prior to 2020, growth in total wage costs was generally only due to increased hours worked rather than any growth in the average hourly wage rate. Since then, wage growth has outstripped the growth in FTEs. This point is highlighted below where the graph shows that from 2019 Pharmacy wage cost growth rate outstripped FTE growth rate.
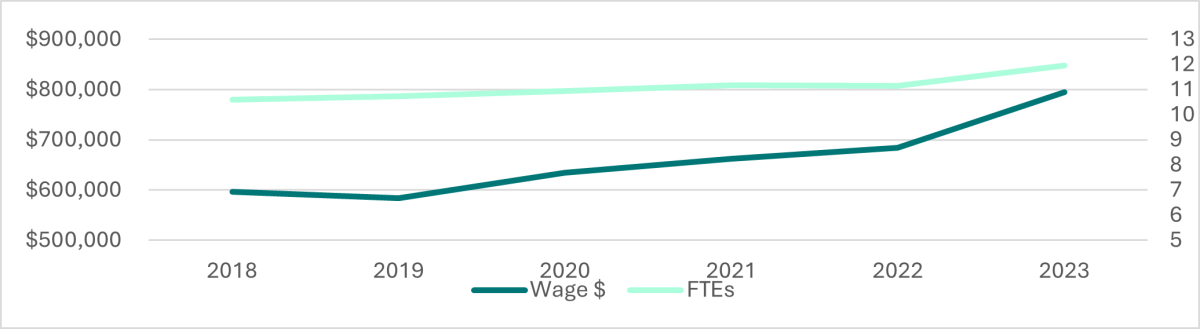
Unsurprisingly for many Pharmacies, FY23 generated a 16% increase in total wage costs driven by an FTE increase of 7% with the balance explained by actual pay rate increases.In other words, Pharmacy hired more people and on average increased all staff wages. So, have pharmacies on average achieved productivity improvements for their increased investment? I.e. is more being accomplished relative to the additional spend now than has been in the past?
Business activity throughout the pandemic was stimulated by the increased workload from vaccinations, sale of rapid antigen tests and patients heightened focus on personal health generally.
Considering this environment we analysed pharmacy productivity movement over the same period to interpret whether ongoing wage increases driven by higher hourly rates are sustainable.
This meant deriving normalised productivity (ex-pandemic factors) by considering the following measures:

Whilst it was clear pharmacies were ‘busy’ during the pandemic, the underlying data provides additional valuable insight.
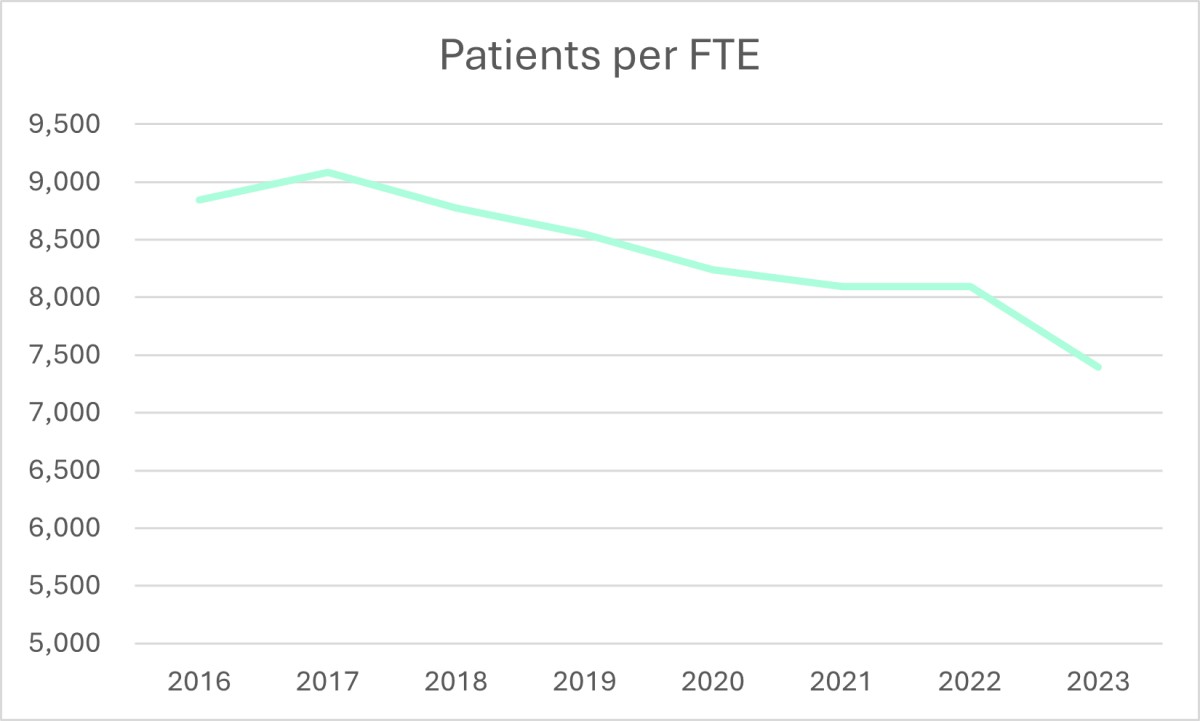
For example, using the below measure, PP data suggests that there has been a steady decline in patients served per FTE since 2017 due to the steady increase in FTEs while patient numbers have not correspondingly increased. Consequently, the number of patients served daily per FTE is now around 20 compared to 24 in 2016.
To understand whether this was a productive investment we measured the revenue opportunities developed from those patients to understand if there is now more paid activity per patient (ie greater productivity). One such measure is service based income per script (where a script acts as a proxy for the dispensary patient). The graph below highlights the trend over the same period (2016 to 2023).
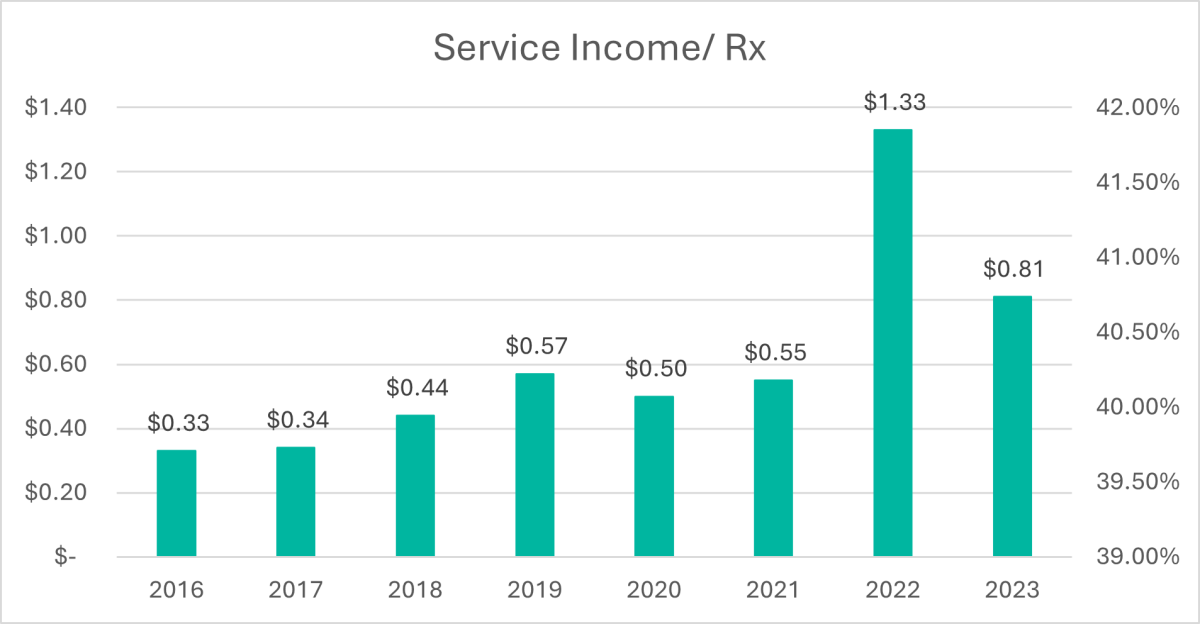
The spike in 2022 was driven by vaccinations however once adjusted for the underlying growth trend, growth remained minimal even though further service opportunities existed under both the 6th and 7th Community Pharmacy Agreements.
Regardless of the meandering income growth from non-vaccination services, pharmacy continues to evolve into a greater blend of health retail and service/s. For customers, the way pharmacy looks and feels is changing and to meet those expectations, efficient workflow processes should also be changing to maintain or improve productivity.
An interpretation of these two activities is reflected within the KPI of script volume per patient.As patient numbers have flattened, the script volume on balance has continued to increase meaning that scripts per patient have increased (driven by an aging population being treated for multiple conditions).
Understanding activity per patient is critical to delivering profit growth based which is underpinned by the efficiency/productivity level of dispensary workflow. Of course, for some Pharmacies, productivity gains can be derived from robotics but before contemplating this, there are efficiency opportunities within most manual dispensing processes. Hence, as activity increases, efficiencies must be obtained to avoid the need for more FTE hours in a limited amount of space to service growth. This is also cornerstone to executing a winning competitive strategy focussed on convenience that incorporates both speed and accuracy.
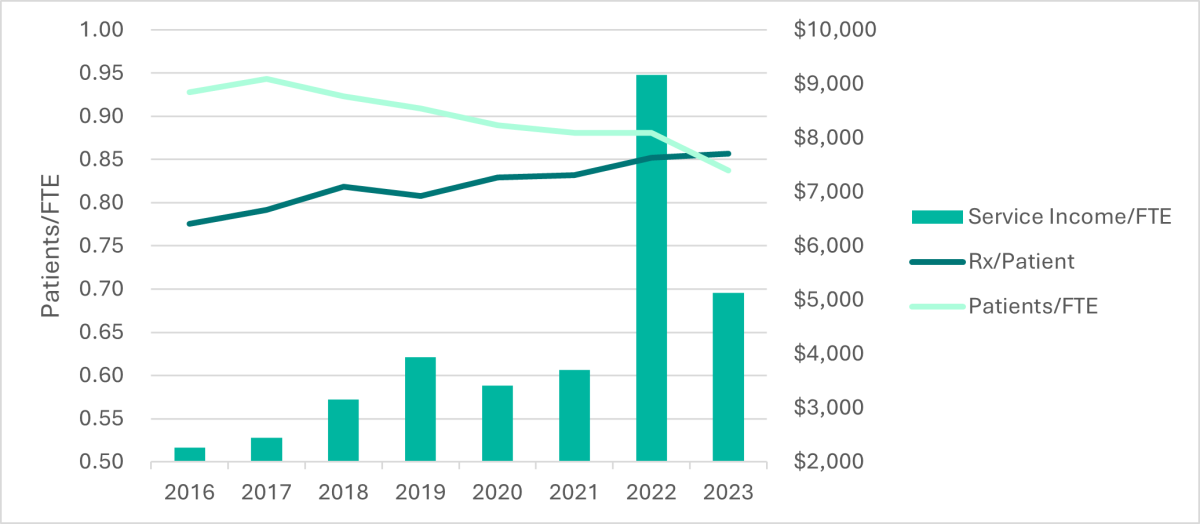
The below graph reports on a pharmacy where a robot was introduced in 2017. Prior to that the owner had struggled to achieve efficiency gains. However, the robot did not prove to be the panacea. With increasing patient and script volume, there was still difficulty in lifting service income.
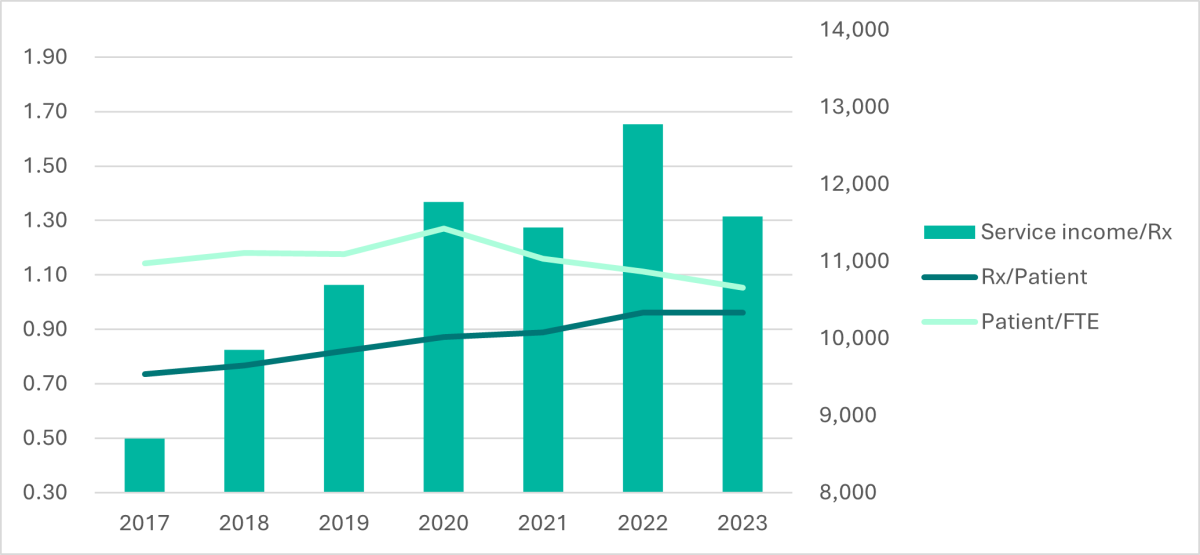
It was clear that even before the pandemic years this pharmacy was on a growth trajectory based on volume per patient and service income. Productivity gains were being achieved because customers per FTE were actually decreasing. In other words, more time was being spent with customers. In fact, during 2022 and 2023, the number of patients served per FTE per day was over 29. This is 45% higher than the total average mentioned earlier.
This is of course predicated on the fact that the right staff are doing the right things at the right time and not getting caught in excessive process.
There is no doubt that pharmacy is changing with the annual uptake of new activities and revenue sources. The key issue to balance is how to maximise the opportunity per patient while optimising staff capacity.
In an overall sense, productivity improvements come from either doing more with the same or the same (or more) with less. How this is achieved is up to individual owners to navigate. Missing an opportunity to do more with patients would be a loss for the pharmacy as well as the patient.
Whilst the changes to date have been subtle, the broadening scope of practice in each State will require store layouts and staff skills/levels to change to better leverage the coming opportunities and requirements under a patient centric operating model. The productivity and profit model are therefore changing.
Understanding your baseline and using the right benchmarks to drive growth is crucial.
At Pitcher Partners, we help decipher this challenge.


Related Content
FEATURED
Will AI change the way customers choose their pharmacy?

Artificial intelligence is no longer just a technology issue. For community pharmacy owners, it is becoming a retail issue, a service issue and a business model issue. A recent article about Coles...
Read MoreBusiness Risks Survey
Pharmacy – Current Owner
How well are you managing your risks as a pharmacy owner? Get your Business Risks Scorecard to see where you need to take action.
Business Risks Survey
Pharmacy – Future Owner
Thinking about buying an interest in a pharmacy? Take our Survey to see if you know the risks.
Survey
Exploring the pharmacy practice impacts of the 2018 re-scheduling of codeine containing combination analgesics in Australia (A pilot study). Please click the button below to participate.
Pharmacy Impact Survey